

Ask InsightGig to create an Excel workbook when you need calculations a colleague can inspect. This example uses a fictional grocery checkout survey.
For the example, set up Retail checkout study using Complete a quantitative study. Check that the project contains Survey/checkout-survey.csv. Have Excel available to inspect the formulas.
Describe the workbook
-
Open Research in the study project. Name the input file and the workbook you want to save.
-
Ask for a Raw sheet with the original rows and a Summary sheet with formulas. For this example, send the following request.
Create Analysis and Reporting/fee-visibility.xlsx from Survey/checkout-survey.csv. Put the original rows on Raw. Use formulas on Summary to count yes, no, and blank by region. Include all four regions and a total. Calculate the total percentage from summed counts. Divide yes by the valid yes-or-no base. Show blanks separately and link the saved workbook. Use Survey/survey-guide.md to include the exact fee question wording on Summary. -
Open the workbook link in the reply. Check the filename and sheets before using the results.
The valid base includes yes and no answers. The workbook reports blank answers separately.
Check the workbook
-
Select Raw and compare its row count and field names with the source.
-
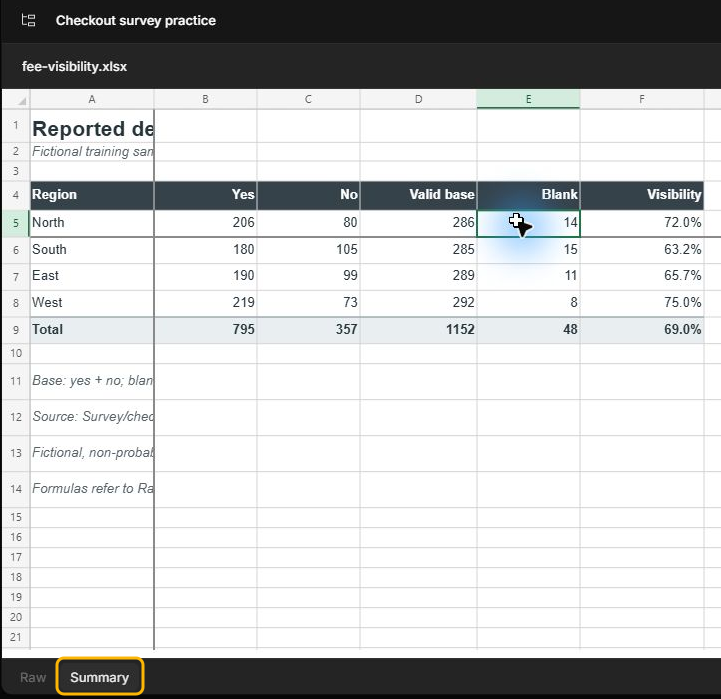
Select Summary. Check counts for one region before reviewing the percentages.
-
Open the workbook in Excel. On the Summary sheet, select a fee percentage and read the formula in the formula bar. Check that it divides the yes count by the valid base for that region.
In the example, North has 206 yes answers out of 286 valid answers, or 72.0%. The 14 blanks remain outside the valid base. Check that Raw has 1,200 responses before checking the total of 1,152 valid answers.
The workbook layout and formulas can vary. Find the percentage for North by its label and check that it uses the counts shown here.
If you need to test changes, save a copy and change one source value there. Confirm that the summary updates as expected before sharing.
Check that Summary gives the fee question’s exact wording as well as the source and the base. Follow Evaluate research outputs to see how Eval flags a missing detail.
For a workbook with linked cost calculations, follow Create complex spreadsheets.