

Use InsightGig to turn survey responses into findings you can trace to the data. You will agree on the rules, verify a result, and prepare a report.
The example uses 1,200 fictional panel responses for a grocery retailer studying first online orders. It compares reported delivery-fee visibility across four regions.
Before you begin
Open the project with your response data, questionnaire, and research brief. Add the codebook if you have one. A codebook explains what each field and answer code means.
For the grocery example, download and extract the files in Complete a quantitative study. In Retail checkout study, find Survey/checkout-survey.csv for the responses and Survey/survey-guide.md for the questions and counting rules.
Keep the original data unchanged. Have Excel available to check a table against the responses and Word available to check a finished report.
Plans, headings, and report wording can vary. With the same source rows and counting rules, the fee counts and percentages should match the checks in this guide.
Set the analysis rules
-
Open the project files. Check that the response file and questionnaire cover the same questions and version. Note any missing materials.
-
Start a session and select Plan. Name the dataset, questionnaire, research question, and output. Ask for a data check and a plan before approving the analysis.
Use Survey/checkout-survey.csv and Survey/survey-guide.md. Plan a two-page report on reported delivery-fee visibility by region. Check the fields, unique response count, and age and region quotas. Use yes and no as the valid base. Keep blanks separate. Wait for my approval before preparing the report. -
Review the plan and check that it expects 1,200 unique responses, with 300 in each region. Check the fee question and rules for blank or excluded answers.
If your survey uses weights, give the agent the weight field and instructions. The grocery example is unweighted, so each included response counts equally.
-
Switch to Research and approve the reviewed plan. Ask for draft findings with source references, counts, bases, and calculations you can verify. Ask to save them in
Analysis and Reporting/survey-checks.md.See Plan and run a task for the controls and handoff.
For a longer survey, ask for a data guide that maps fields to questions. Check it against the questionnaire and note any fields the agent cannot match.
Verify the counts and bases
-
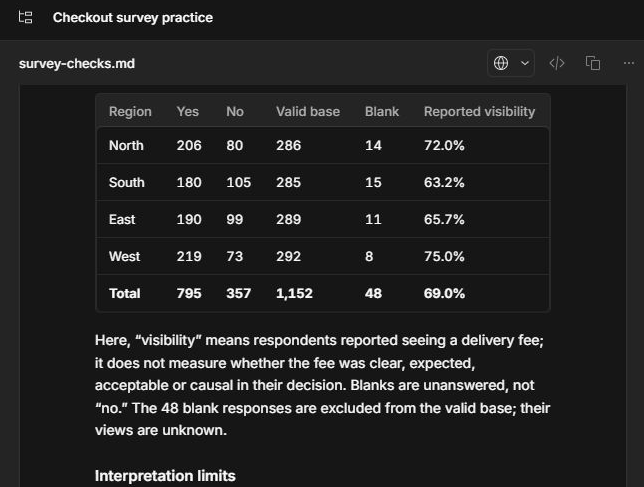
Open the draft or the saved checks from the reply. Find the table for the fee question and identify its valid base.
A valid base is the number of answers included in the calculation. Here, it includes yes and no. A blank means no recorded answer.
-
Open
Survey/checkout-survey.csvin Excel and filterregiontoNorth. Count 206 yes answers, 80 no answers, and 14 blanks undersaw_delivery_fee. -
Divide 206 by the 286 valid answers to get 72.0%. For an overall figure, add the counts first and divide total yes answers by the total valid base.
| Group | Yes | No | Valid base | Blank | Saw the fee |
|---|---|---|---|---|---|
| North | 206 | 80 | 286 | 14 | 72.0% |
| South | 180 | 105 | 285 | 15 | 63.2% |
| East | 190 | 99 | 289 | 11 | 65.7% |
| West | 219 | 73 | 292 | 8 | 75.0% |
| Total | 795 | 357 | 1,152 | 48 | 69.0% |
The survey has 1,200 rows. The overall percentage uses 1,152 valid answers. Interpret the percentage as reported visibility. Understanding and acceptance would each need their own survey question.
Check comparisons and exceptions
For a larger survey, use these checks before approving the draft.
| Check | What to confirm |
|---|---|
| Question routing | Only eligible respondents are included in results for that question. |
| Multiple answers | The draft states whether percentages use respondents or selections as their base. |
| Recoded categories | The draft documents which answers were grouped and why. |
| Small groups | The report gives the base and explains when a comparison is too uncertain to use. |
| Weights and tests | The report states the weights, methods, exclusions, and how several comparisons were handled. |
For a follow-up, ask for the same table by device within each region. In North, 131 of 189 mobile respondents and 75 of 97 desktop respondents answered yes. Those bases exclude 10 mobile blanks and 4 desktop blanks. This sample has regional and age quotas. Treat the device comparison as a description of these responses.
For an unexpected base, type Recheck the fee table. Show the source field, included rows, exclusions, and calculation for each region. Review the revised table before approving it.
Approve and open the final report
-
Review the draft and request any corrections. Once the counts and claims agree with the source, ask Research to save the approved content as
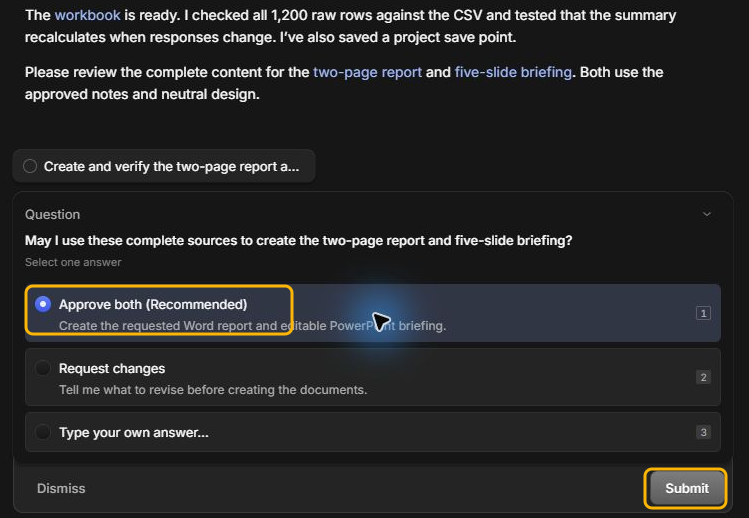
Analysis and Reporting/checkout-survey-report.docx.If the agent asks you to confirm the draft or page count, make your choice and select Submit.
The screenshot shows an approval question for the two-page report and a separate deck. The agent can also ask for approval of the report by itself.
-
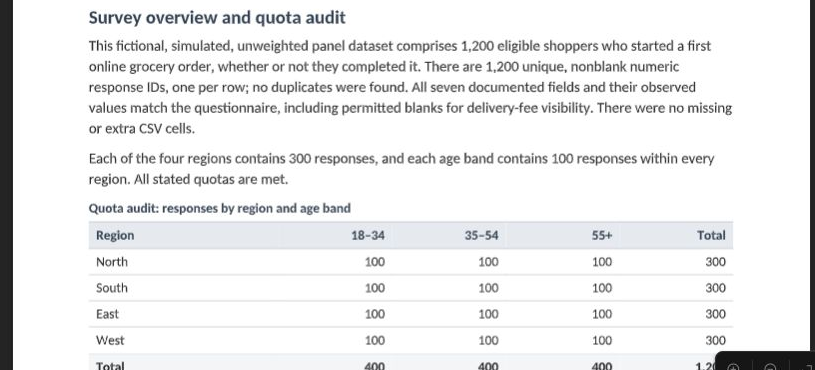
Open the saved file from its link or use Find and preview project files to open it in Word.
-
Compare the final tables, labels, and limits with the approved draft. If you need a separate action summary, ask the agent to use only the checked findings.
Keep the source data, analysis rules, and checked tables with the report. Describe unavailable sample details as gaps in the evidence.
Next steps
Use Create a spreadsheet to save the calculation in a workbook. Use Evaluate research outputs to review the report against the questionnaire and data.