

Make a workbook that shows how many shoppers saw a delivery fee in a fictional grocery checkout study. Allow about 25 minutes to check the data and prepare a slide. A detailed evaluation or revisions may take longer.
Before you begin
Download the retail checkout practice files. In File Explorer, right-click the download and select Extract All. Name the extracted folder Retail checkout study.
If you used the files for Complete a qualitative study, keep that project. Check that its survey file has 1,200 responses. If you have an earlier version, extract the new download to a separate folder.
Sign in to the desktop app and Check credits and usage before starting. Have Excel and PowerPoint available to check the final files.
The Survey folder contains a questionnaire and a CSV file, which is a table saved as text. The dataset has 1,200 fictional responses. It has 300 per region, with 100 in each of three age bands per region.
Your workbook and slide can look different from the screenshots. With the same counting rules and source file, the counts and percentages should match the guide.
Part 1 Check the measure and its base
- Open the
Retail checkout studyproject from Before you begin. If you just extracted the folder, use Add and switch projects to add it. - Start a session in Retail checkout study. Select Open project files and expand Survey. Read
survey-guide.mdand confirm thatcheckout-survey.csvcontains the named fields. - Identify the base for fee visibility. The guide uses shoppers who answered yes or no. Keep blanks as unanswered.
You should know the input file, field, and rule before asking for a percentage.
Part 2 Calculate and check the results
-
In the session you opened in Part 1, select Research and send this request.
Read Survey/survey-guide.md and Survey/checkout-survey.csv. Check the unique response count and the region and age quotas. Report yes, no, valid base, blanks, and fee-visibility percentage by region. Save Analysis and Reporting/survey-checks.md and link it in the reply. -
Open
survey-checks.mdfrom the reply. For North, verify 206 yes, 80 no, and 14 blank. The fee percentage is 206 divided by 286, or 72.0%.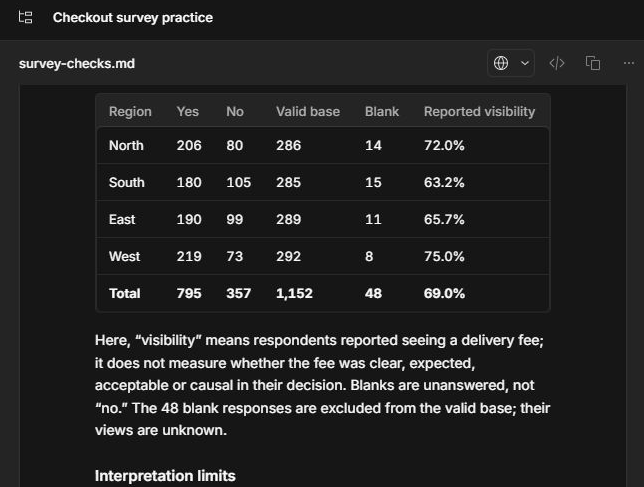
Check that the valid bases add to 1,152 and the blanks add to 48. The results describe this fictional quota sample.
Part 3 Create and review the workbook
-
Send the request in Create a spreadsheet to save
Analysis and Reporting/fee-visibility.xlsxin this project. -
Open the workbook from the reply. Compare its counts with
survey-checks.mdfrom Part 2 and inspect one formula in Excel. -
Follow Evaluate research outputs to recompute the results and check the workbook. Read its findings and check any limits it reports.
You should have a checked workbook that shows how each percentage was calculated.
Part 4 Prepare a slide for the study team
-
In Research, send this request in the same project. It uses
survey-checks.mdfrom Part 2 andfee-visibility.xlsxfrom Part 3.Create one editable PowerPoint slide in Analysis and Reporting/fee-visibility-slide.pptx. Use fee-visibility.xlsx and survey-checks.md from Analysis and Reporting. Show the fee-visibility percentage, valid base, and blank count for each region and the total. Name the source workbook and say these are fictional quota-sample results. Show me the proposed content before making the slide. -
Check the proposed content and approve it. Open the saved
.pptxfile in PowerPoint when it is ready. -
Compare all four regions and the total with the workbook. North is 72.0% from 286 valid answers, and West is 75.0% from 292.
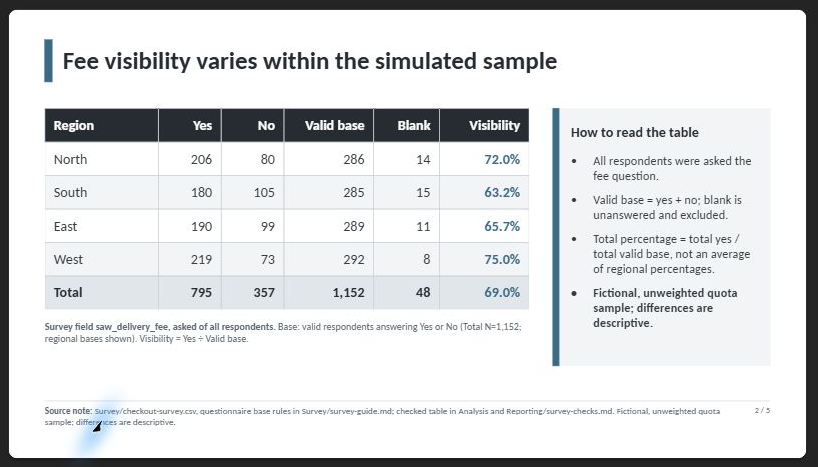
You should have one editable survey slide that cites the workbook and describes the sample limits. The screenshot shows the regional comparison as part of a longer briefing.
Next steps
Follow Analyze survey data for a wider survey analysis. Use Synthesize research findings to bring interview evidence into the same report.
Follow Create a PowerPoint presentation to use that synthesis in a five-slide briefing.