

Create a PowerPoint presentation when you need to explain a research decision or share checked findings. Start with a reviewed source note or workbook.
For the five-slide example, complete Synthesize research findings. In Retail checkout study, check that Analysis and Reporting contains checkout-synthesis.md and survey-checks.md before starting the deck.
For a survey-only slide, use the request in Complete a quantitative study. Have PowerPoint available to check the saved slides.
The agent may propose different slide titles, layouts, or approval questions. Check that your deck covers the requested topics and matches the checked source figures.
Ask for a deck
-
Open a Research session in the study project. Type
@slidesand choose PowerPoint Presentation.
-
Name the source files, audience, and decision. Specify the slides you need and the output filename. For the retail practice project, use this request.
Create Analysis and Reporting/checkout-briefing.pptx for the retail research team. Use checkout-synthesis.md and survey-checks.md in Analysis and Reporting. Plan five slides covering the decision, sample, fee visibility, interview evidence, and next research steps. Use an editable table for the four regions and total. Include valid bases and blanks. Keep the deck editable and cite the source files. Show me the proposed content before creating it. -
Send the request. If the agent links a draft or asks you to choose the slide count, check the proposed content before approving it.
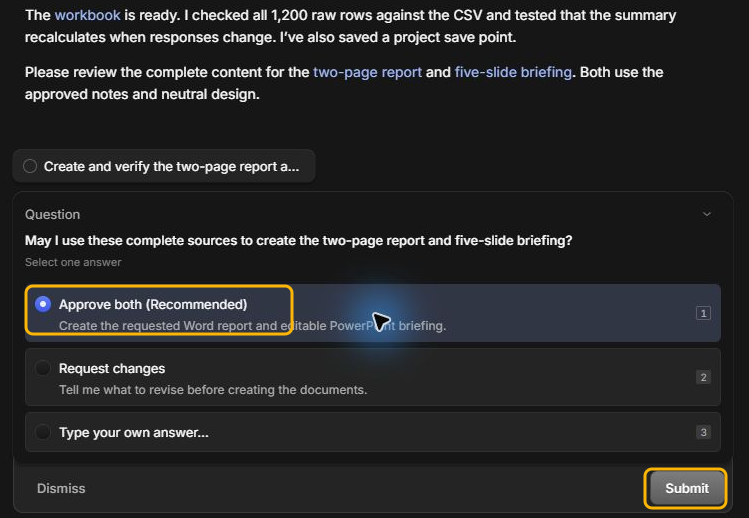
Open and review the presentation
-
Wait for the presentation to finish. The Renderer activity shows when InsightGig is preparing the deck. Select the
.pptxlink in the reply to open the saved file.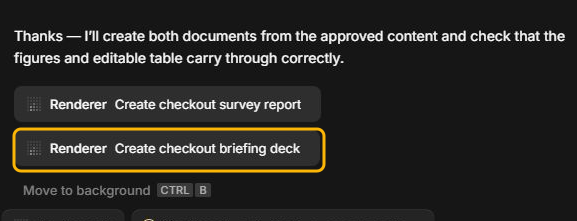
-
Open the deck in PowerPoint. Check the slide order, titles, charts, labels, and source notes.
-
Compare each reported figure with
Analysis and Reporting/survey-checks.md, the checked source note used to make the deck. North has 286 valid answers and West has 292.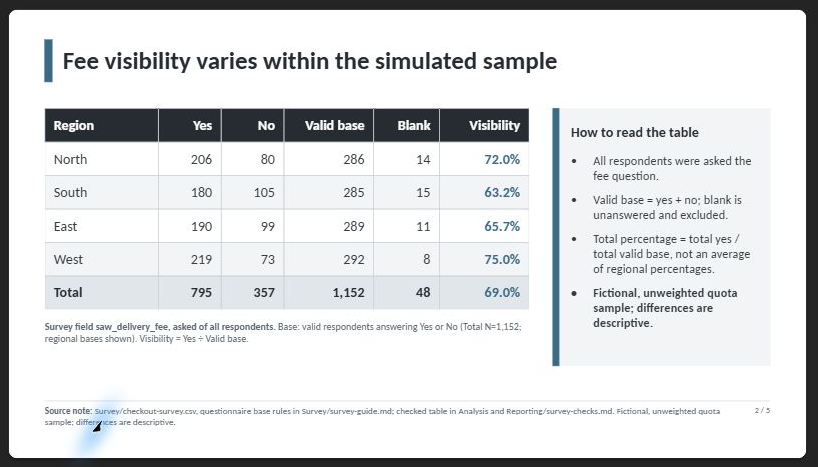
Check that the percentages in a chart use the intended scale. For North, the slide should show 72.0%, with a valid base of 286 and 14 blank answers.
If a slide needs a change, ask Research for a specific revision. Reopen the saved file and check the revised slide with its neighbours.
Use Evaluate research outputs to review the deck against its brief and source files. Check its appearance in PowerPoint before you share it.